Introduction to HR Dashboards

What are dashboards?
Dashboards are visual tools that are used to clearly display data.
Using graphs, tables, indicators and other visualizations, they allow you to concentrate key information in one place.
Dashboards connect different data sources and update them regularly, so the user always sees the current status.
Essentially, it is a modern form of reporting - instead of long tables or complex documents, it offers a quick and intuitive overview.
What is the module used for?
In the area of HR, dashboards help HR professionals and managers monitor important indicators and processes.
They can display, for example, starts, departures, and fluctuation or the number of employees.
Thanks to them, it is possible to quickly identify problems and effectively plan next steps.
Dashboards save time, increase clarity and support informed decisions because all key information is available in one place and presented in a visually understandable way.
How do dashboards work in practice?
HR Dashboards is a module that is based on live data , i.e. it displays current information directly from the database.
For example, if we see in the overview of starts that 23 people started in April 2024 and then we add another employee to the system during this period, the number is immediately updated to 24.
Dashboards process only data from primary contracts.
Where can you find dashboards?
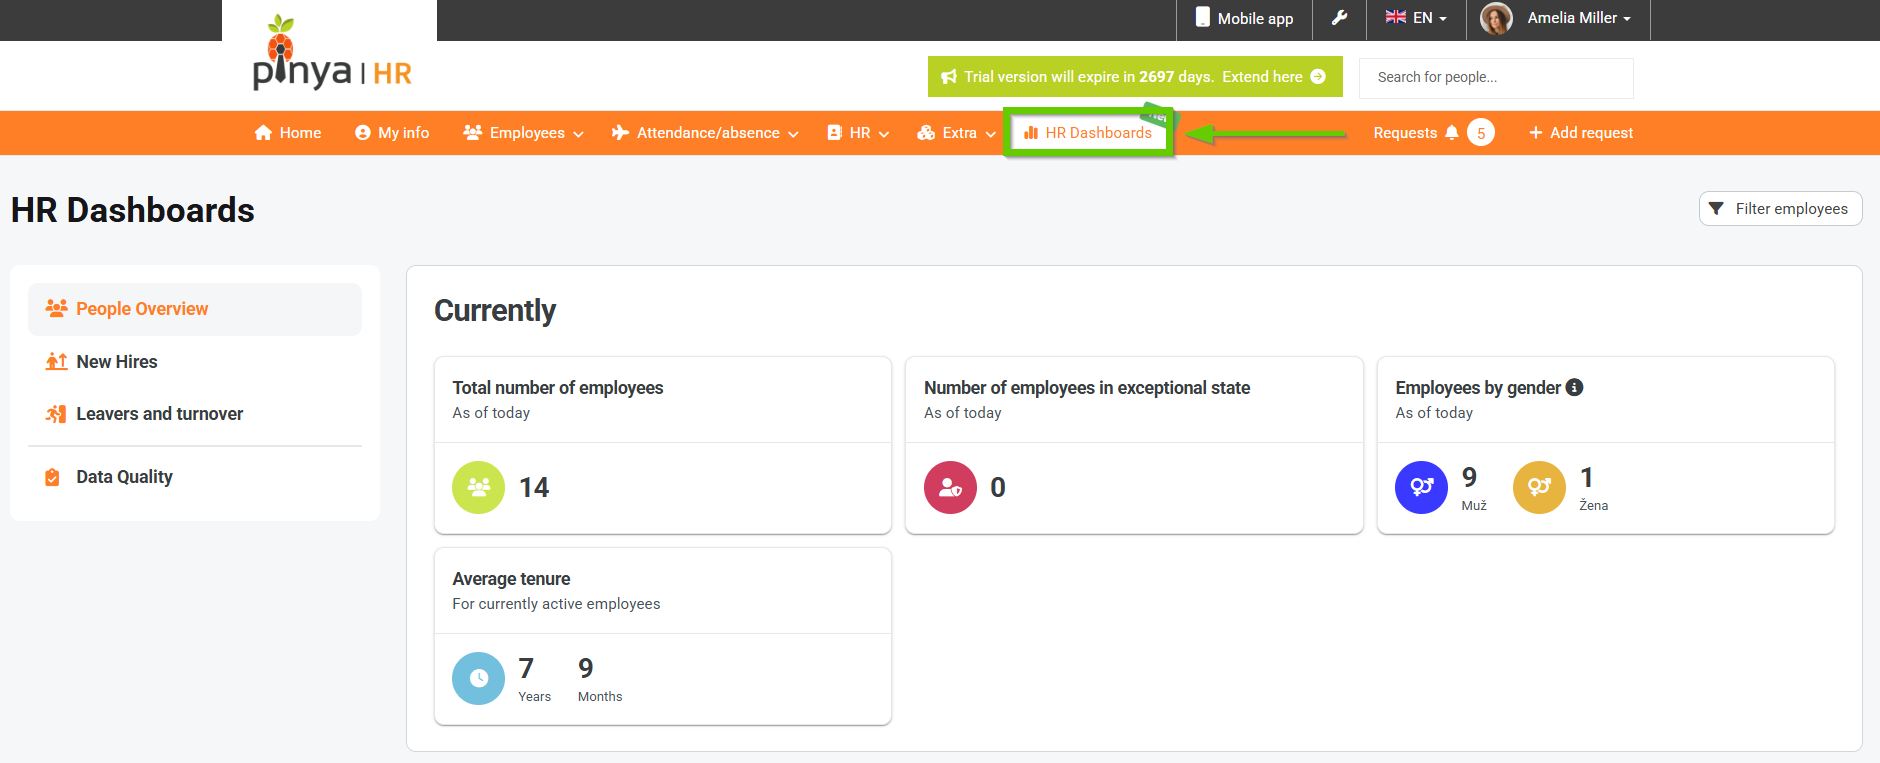
Dashboards can be found in the main navigation menu on the HR Dashboards tab.
On the left side of the screen there is a signpost to the individual dashboards available in the system:
- People in the company
- Boardings
- Departures and turnover
- Data quality